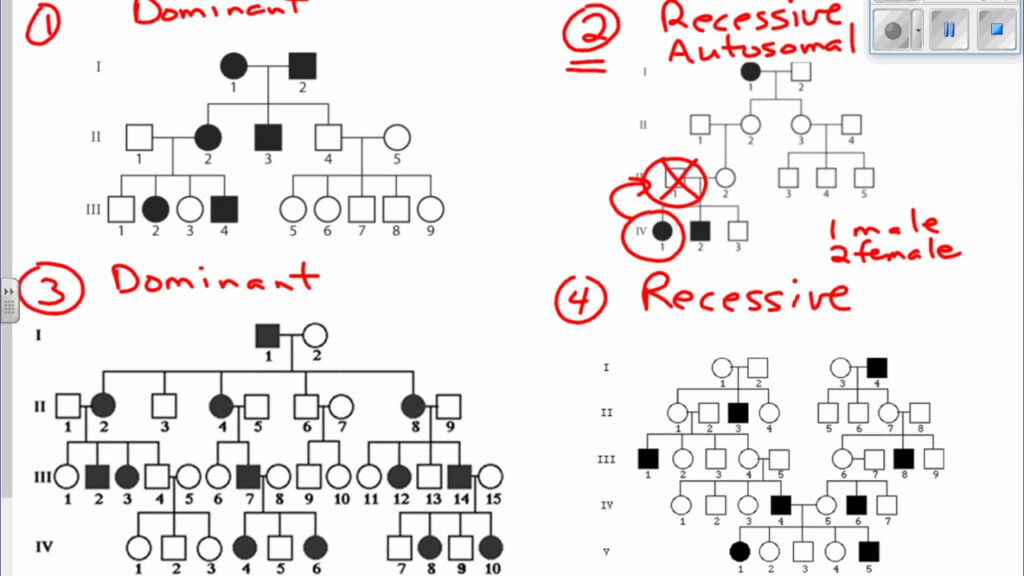
In biology, a pedigree chart is a diagram that shows the genetic relationships within a family. It is commonly used to track the inheritance of a specific trait or disease through generations. Each individual in the chart is represented by a symbol, typically a circle for females and a square for males. Lines connecting the symbols indicate family relationships, with different types of lines denoting different relationships such as marriages, siblings, and offspring.
Pedigree charts are valuable tools for geneticists and researchers to study patterns of inheritance in families. By analyzing the information presented in a pedigree chart, scientists can determine the mode of inheritance of a particular trait or disease, whether it is dominant, recessive, X-linked, or multifactorial. This information is crucial for understanding the genetic basis of various disorders and for providing genetic counseling to individuals and families at risk.
Pedigree Chart In Biology
Interpreting a Pedigree Chart
When examining a pedigree chart, certain symbols and patterns can provide important information about the inheritance of a trait or disease. For example, a filled-in symbol indicates an individual who expresses the trait, while an empty symbol represents a non-expressing individual. Consanguineous marriages, where the parents are closely related, are denoted by a double line connecting the symbols. Understanding these symbols and patterns can help geneticists make accurate predictions about the likelihood of a trait being passed on to future generations.
