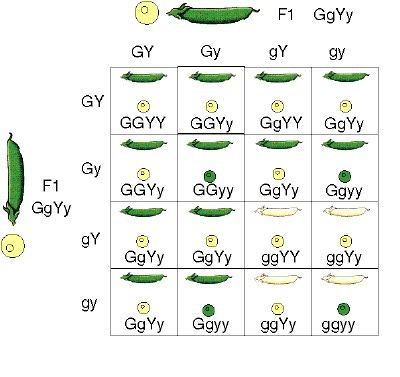
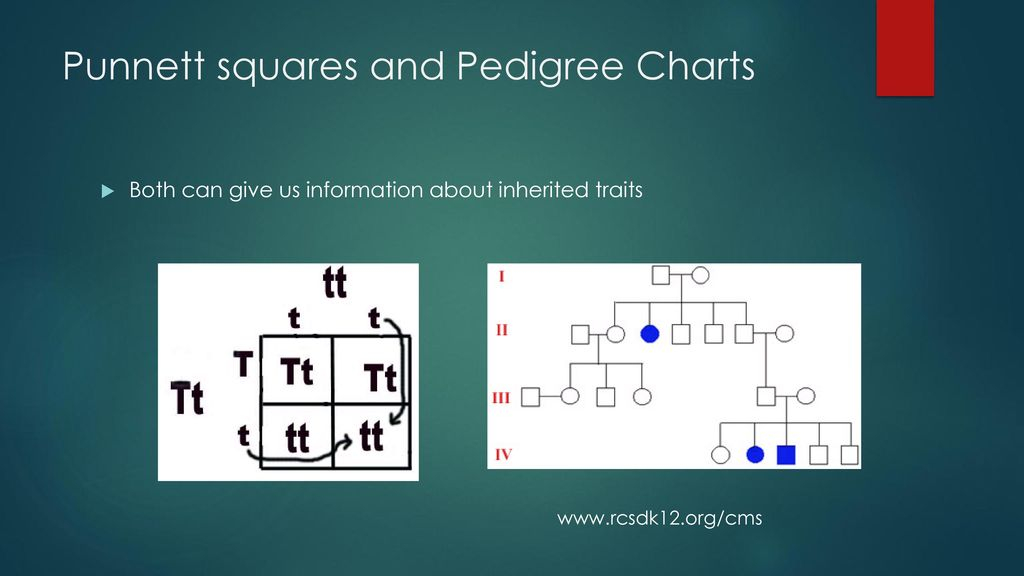
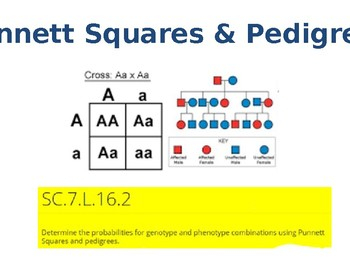
Punnett squares are a valuable tool used in genetics to predict the outcome of a cross between two individuals. This method was developed by British geneticist Reginald Punnett in the early 20th century. Punnett squares are a visual representation of the possible genetic outcomes of a mating between two individuals, based on their genotypes.
To create a Punnett square, you need to know the genotypes of the parents. Each parent contributes one allele for each gene to their offspring. By combining the possible alleles from each parent, you can determine the probability of each genotype in the offspring. Punnett squares are especially useful in determining the likelihood of inheriting certain traits or genetic disorders.
Punnett Squares And Pedigree Charts
How to Use Punnett Squares
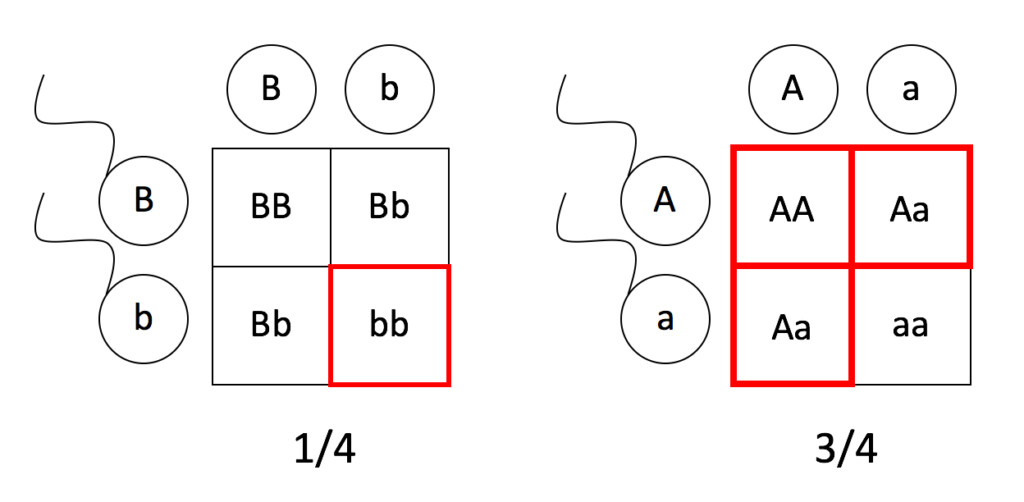
To use a Punnett square, you first need to determine the genotypes of the parents. Then, you can create a 2×2 grid with each parent’s alleles on the top and left side. Fill in the squares with the possible combinations of alleles from each parent. The resulting genotypes in the squares represent the potential offspring genotypes.
Punnett squares can be used to predict the likelihood of different genotypes in offspring, as well as the probability of inheriting specific traits. They are a simple and effective way to visualize genetic inheritance patterns and are commonly used in biology and genetics courses.
Understanding Pedigree Charts
What Are Pedigree Charts?
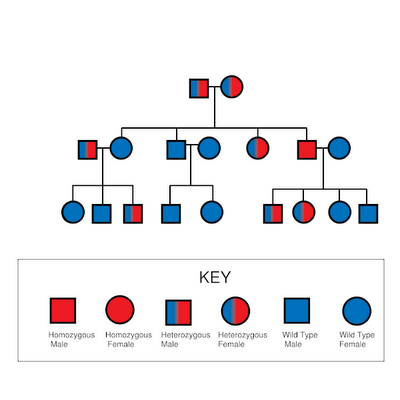
Pedigree charts are diagrams that show the genetic relationships within a family over several generations. These charts are used to trace the inheritance of traits or genetic disorders through a family tree. Pedigree charts are commonly used in genetics to study patterns of inheritance and to identify carriers of genetic diseases.
In a pedigree chart, squares represent males, circles represent females, and shaded symbols indicate individuals affected by a particular trait or disorder. Lines connecting individuals show parent-child relationships, and patterns of inheritance can be traced through the generations. Pedigree charts are an essential tool in genetic counseling and research.
How to Interpret Pedigree Charts
Interpreting pedigree charts involves analyzing the patterns of inheritance within a family tree. By studying the relationships and patterns of affected individuals, geneticists can determine the mode of inheritance of a particular trait or disorder. Common inheritance patterns include autosomal dominant, autosomal recessive, X-linked dominant, and X-linked recessive.
Pedigree charts can also be used to calculate the probability of an individual inheriting a particular trait or disease. By understanding the relationships and patterns in a pedigree chart, geneticists can provide valuable information for genetic counseling and diagnosis. Pedigree charts are a powerful tool for understanding genetic inheritance and can help individuals make informed decisions about their health.
By incorporating Punnett squares and pedigree charts into genetic studies, researchers and genetic counselors can gain valuable insights into patterns of inheritance and genetic disorders. These tools provide a visual representation of complex genetic relationships and help predict the likelihood of specific traits or diseases in offspring. Understanding how to use Punnett squares and interpret pedigree charts is essential for anyone studying genetics or interested in their own genetic health.
Download Punnett Squares And Pedigree Charts
Pedigree Chart And Punnett Square Sickle Cell Anemia
Biology More Genetics Ppt Download
Pedigrees And Punnett Squares Mt Hood Community College Biology 102
Punnett Squares And Pedigrees By Judy Bremner TPT
